ROI Calculation Framework for Warehouse Robot Projects
Learn where warehouse robot ROI models fail and how to build honest ones.

Advertisement
Warehouse robot ROI models fail for a specific, repeatable reason: they get built to clear an approval committee, not to survive a warehouse floor. Companies sign off on a clean version, then discover eighteen months later that the version that got signed and the version that actually happened are two different documents. The gap between them is where budgets get burned, and it's almost always the same two mistakes doing the burning.
A vendor shows up with a tidy payback slide, the deal gets signed, and the labor line doesn't move the way the model promised. Finance starts asking questions nobody wants to answer, because the model was built to win a room, not to describe a warehouse. That's a different design goal, and it produces a different document.
Two mistakes appear in almost every proposal put in front of an operations leader. Labor savings get calculated against peak staffing costs instead of the actual weighted mix of workers a facility carries across a full year. Robot utilization gets treated as though the machine hits full theoretical capacity from day one, when a realistic first-year number sits closer to 80%. Both errors point the same direction, toward a rosier number than the floor will ever produce.
Distribution centers don't run like factories on a flat production line. Seasonal demand curves, SKU counts that keep climbing, promotional spikes, and a labor market that swings hard quarter to quarter all create daylight between what a model plans for and what a warehouse actually does. A model built on average daily throughput misses in both directions: too conservative in November, too optimistic in February.
Market pressure and its effect on an internal approval decision
Warehouse automation was valued at $29.98 billion in 2026 and is projected to hit $59.52 billion by 2030, an 18.7% compound annual growth rate. Roughly 80% of warehouses still run with no automation. The competitive window is open right now, and at that growth rate, it won't stay open long.
Labor cost pressure is structural. Wages for the core warehouse job categories, industrial truck operators, hand material movers, shipping and receiving clerks, stock clerks, are in the mid-to-high $40,000s a year, and turnover runs around 36% annually. Replacing one worker costs anywhere from 25% to 150% of that worker's salary depending on role and training time, and workforce instability alone tends to push operating costs 15% to 25% above industry norms.
Most approval committees treat "do nothing" as a flat baseline, one that costs the same in year five as it does today. That assumption is wrong on its face. Warehouse wages have climbed materially since 2020 in most markets, and any five-year projection needs to account for volume growth already on the books, and a flat wage assumption deserves scrutiny. Quietly assuming the status quo holds its price is the single easiest way to make automation look like a weaker bet than it actually is.
The core formula and its need for monthly granularity
The math isn't complicated. ROI equals annual labor cost savings plus productivity gains, minus annual robot costs, divided by total investment, times 100.
Run it on a representative deployment: $1,000,000 upfront, $300,000 in annual revenue increase, $50,000 in annual savings, $100,000 in annual expenses. Net that out and the annual benefit comes to $250,000, a 25% annual ROI, and a four-year payback period. Nothing wrong with the formula itself.
The danger sits in how it gets applied over time. Most models get built at annual granularity, one number for year one, one for year two, and so on. That hides the ramp completely. Build the same model with monthly steps for the first twelve months, then quarterly steps for years two through five, and the integration period becomes visible: the stretch where robot costs are already running but full productivity hasn't arrived yet. A model that shows a healthy positive ROI at annual resolution can show negative cash flow for the first six to nine months once broken down by month, and a committee that never sees that stretch has no way to plan around it.
Treat the calculation as six linked components instead of one lump sum: labor baseline, robot productivity, fleet sizing, utilization, integration cost, and capital payback, each one feeding into the next. The Autonomy Bridge Robotics ROI Model organizes the math this way, and the labeling isn't the point. The chain effect is. Get utilization wrong at step four, and that error doesn't stay contained there. It compounds through fleet sizing and payback right along with it.
Building an honest labor cost baseline from your own data
Base wage is not fully loaded labor cost, and treating it as such is the fastest way to understate what automation actually saves. Fully loaded cost includes base wage plus benefits, payroll taxes, workers' compensation insurance, the amortized cost of recruiting and training, plus vacancy time and the productivity drag of a new hire still ramping up. In a typical facility, that fully loaded figure runs well above the base wage, often by half again or more. A $20-an-hour base wage turns into a noticeably higher number once everything gets counted, and a model that skips this step starts wrong before a single robot enters the picture.
A single annual average wage still gets the baseline wrong, for a specific reason. Permanent associates carry full benefits and paid time off, which pushes their loaded cost up. Temp workers cost less per hour in benefits, but agency markup eats into that gap, and temp labor carries a hidden cost in higher error rates and lower output during the ramp-up window every new hire goes through. Blend the two populations into one average and the result describes neither group accurately.
The fix is a weighted weekly model run across all 52 weeks, with permanent and temp labor tracked separately rather than averaged together. Pull three years of historical labor data to build it. That's enough history to catch wage trend lines, agency markup swings, and the real week-by-week temp-to-perm ratio, instead of mistaking one unusually good or bad year for the norm.
Quantifying throughput, error reduction, and space as financial line items
Cost per pick is the number that turns warehouse operations into a language finance can actually read. Manual picking, walking person-to-goods, runs several dollars per pick. AMR-assisted picking drops that well below the manual figure. Fully robotic picking in a structured environment can reach $0.08 to $0.12 per pick. Facility layout and SKU mix decide where a given operation lands in that range, and no vendor slide can substitute for measuring your own.
Throughput gains appear in a few distinct ways, and each one converts into either revenue or reduced headcount need. Goods-to-person AMR systems typically run pick rates two to three times higher than a person-to-goods walking workflow. Robots also skip the shift change a human crew needs: extended or off-shift operation can lift daily throughput 30% to 50% in facilities where the local labor market caps how many human shifts are realistically staffable. For peak season specifically, the honest comparison is robot cost against the full price of the temp program the robot replaces, including agency fees, the lower output of workers still learning the job, and the higher error rate that comes with them.
Error reduction deserves its own dollar figure. Each mispick costs somewhere between $22 and $75 in direct cost alone, before counting any hit to customer lifetime value from a bad shipment. Even a modest reduction in error rate across a high-volume facility translates into meaningful avoided costs at the low end of the mispick cost range. Robot-guided or robot-executed picking generally runs in the high 90s for accuracy, well above unassisted human picking, and that gap flows straight into avoided rework, reshipping, and returns processing.
Space is a real financial line item, not a nice-to-have. Goods-to-person systems pack inventory at meaningfully higher density than conventional racking, which frees up floor space. That space is either a deferred facility expansion that never has to happen, or square footage that gets leased out. Either way, it belongs in the model as a dollar figure.
The costs vendors routinely exclude from their proposals
Hardware is the visible cost, and it's genuinely wide-ranging: Hardware costs vary widely by technology type and scale, from relatively accessible entry points for simpler AMRs up to substantial capital outlays for full picking or sorting systems. Hardware is often a minority of what a project actually costs in year one. The rest is where vendor proposals go thin, and that thinness reflects the fact that error reduction and integration costs are harder to quantify than hardware. It's where the margin lives.
Integration is the expense that gets left off the slide most consistently. Software customization, changes to the warehouse management system, and network infrastructure upgrades routinely add 20% to 30% on top of hardware cost, a cost that is neither a rounding error nor optional. That's not a rounding error, and it isn't optional. Most existing WMS platforms weren't built with a specific robot vendor's system in mind, so someone has to bridge that gap, and bridging it costs real time and real money. In complex deployments, integration can end up costing about as much as the hardware itself, a number few proposals state anywhere near the top.
The annual operating cost needs to appear as explicit line items too, instead of getting waved off as minor upkeep. Maintenance contracts run as a recurring percentage of hardware cost. Software licensing scales with fleet size, so it grows as the deployment grows. Energy is a genuine bright spot: automated systems typically run 30% to 40% more efficient on energy than a comparable manual operation. But the robots still draw power, and that needs its own line rather than getting folded into "savings" where nobody checks it again.
The broader point is that real annual operating costs, once integration and ongoing operations are counted rather than assumed away, routinely run well above what vendor proposals suggest upfront.
Utilization: the single assumption that breaks more models than any other
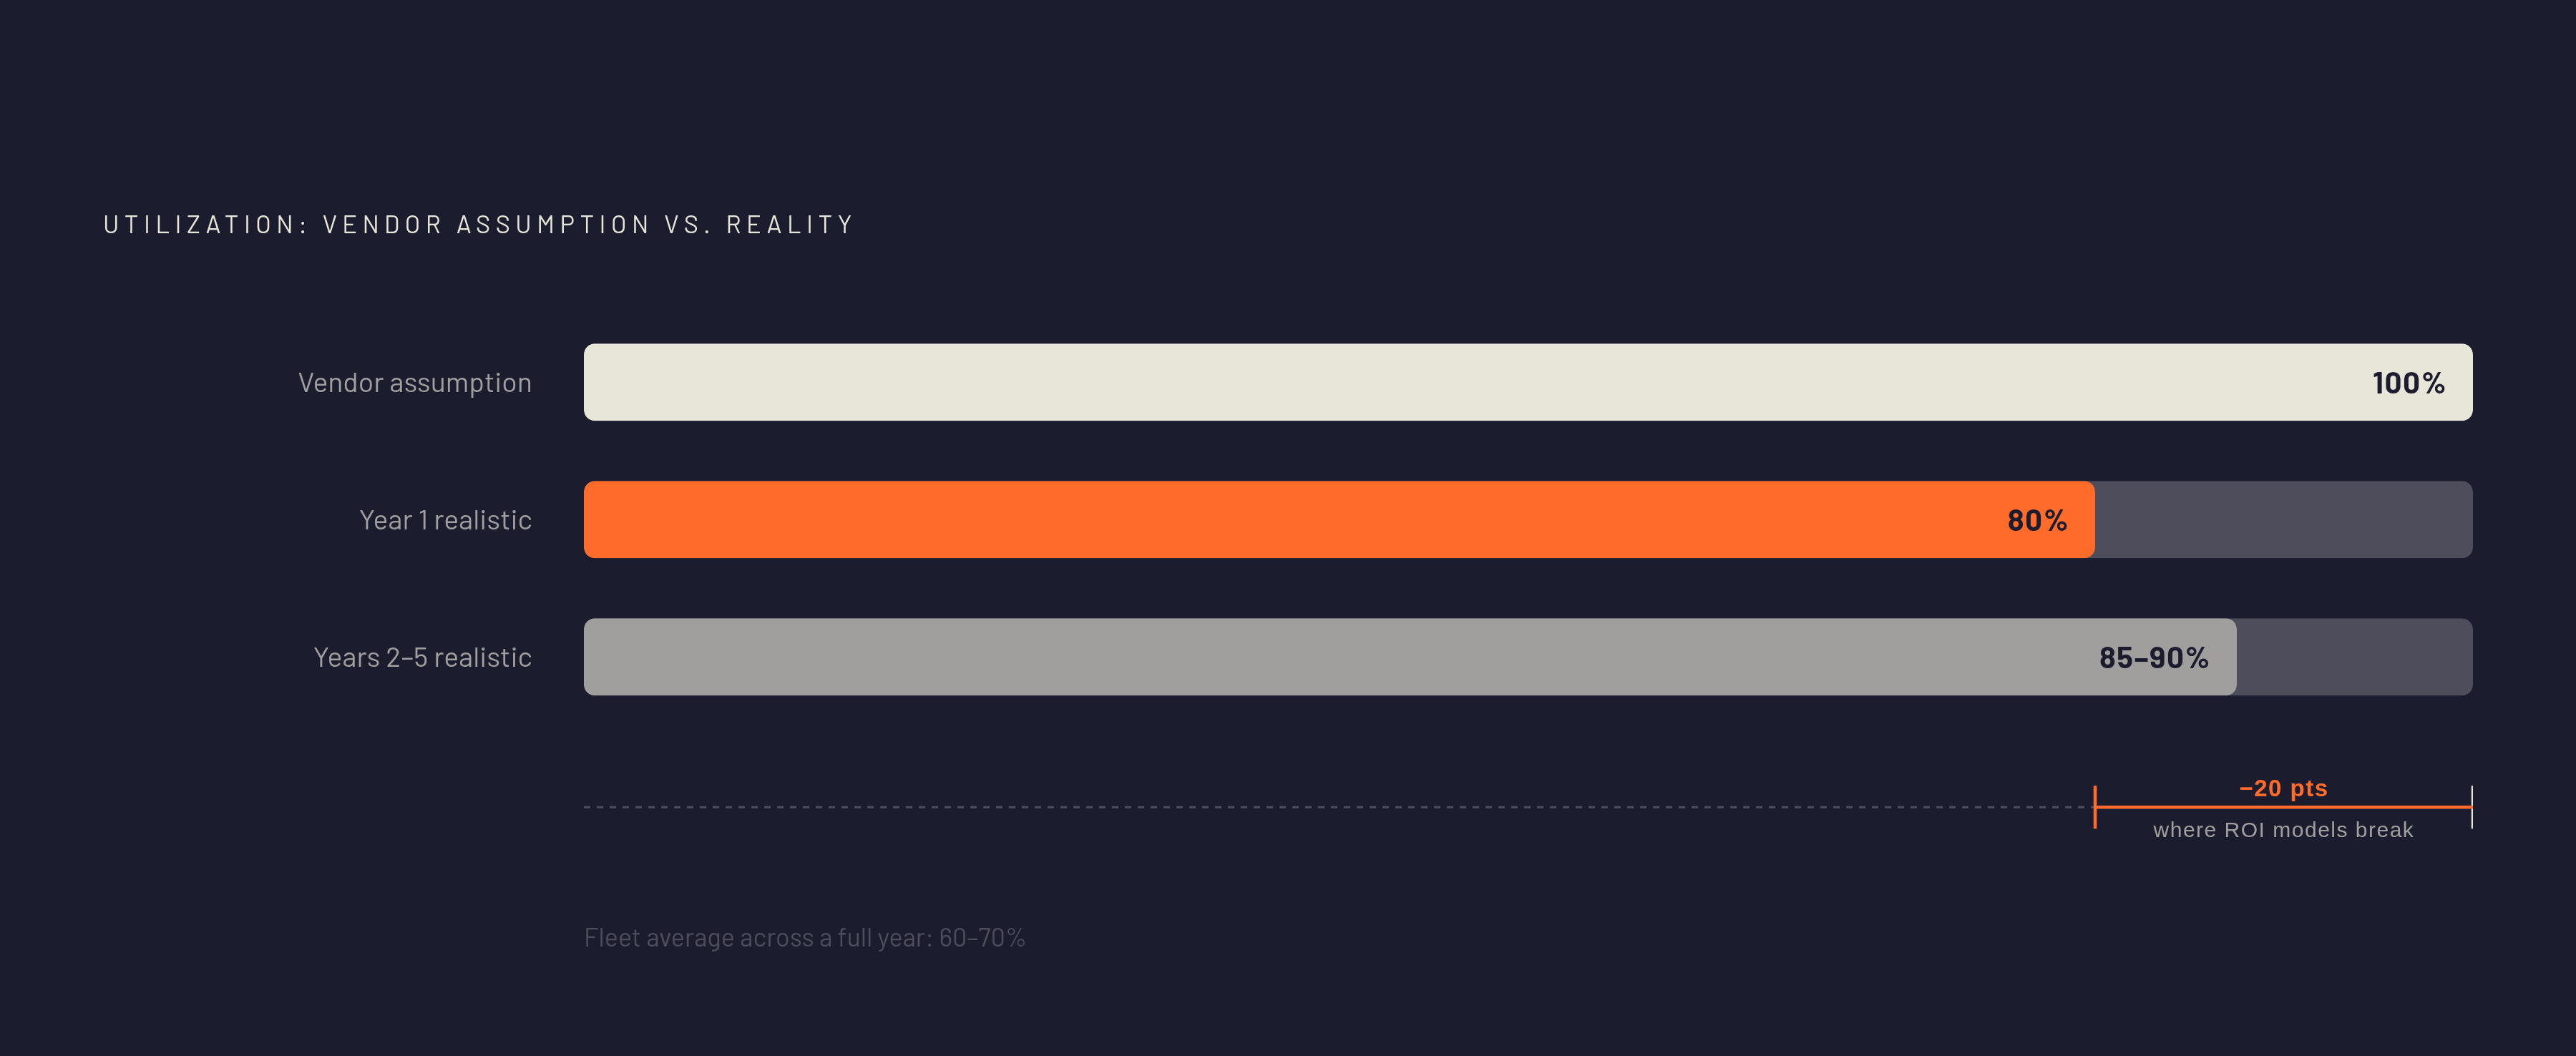
Say a facility runs 150 associates during Q4 peak, and a robot system could theoretically do the work of 30 of them. The vendor math usually goes wrong right here: it takes those 30 headcount, multiplies by the peak-season loaded labor rate, multiplies by 52 weeks, and calls that the annual savings. Those 30 people were only ever staffed for a few peak weeks, not all 52, and the robots delivering peak-equivalent output don't run at peak efficiency year-round either. Realistic average utilization for a robot fleet is 60% to 70% across a full year, and any model that skips this arithmetic is quietly promising labor savings that no warehouse will collect.
Assuming 100% utilization is the single most common way an ROI projection ends up too optimistic, and it deserves to be called out as the main offender rather than one factor among several. Robots don't run at theoretical capacity, full stop. Maintenance windows, charging cycles, and edge cases that need a human to step in all eat into uptime, and none of that is a flaw in the technology. It's just what running physical equipment actually looks like.
Plan for around 80% utilization in year one, while the system and the team running it are still working out the kinks. Expect that to climb to 85% to 90% in later years as edge cases get resolved and maintenance schedules settle into a rhythm. A sound modeling approach enters task coverage only after accounting for availability losses, failed cycles, and human intervention, and keeps ongoing operational support costs in a separate annual line. Use actual pilot logs, completed work and intervention rates, as the basis for that math rather than relying on spec-sheet figures alone.
Realistic payback benchmarks by technology type
Payback period and ROI answer two different questions, and a committee that only asks one of them ends up with a skewed answer. Payback period asks when the capital comes back. ROI asks how profitable the investment is over its whole useful life. Committees lean hard on payback period because it's simpler to explain, and that bias carries a real cost: a system with a short payback that goes obsolete before it accrues meaningful ROI is a worse investment than a more adaptable system with a longer payback and a longer earning life after that point. Anyone building a committee deck around payback period alone is answering the easier question instead of the right one.
The benchmarks vary by technology in ways that reflect exactly this trade-off. Autonomous pallet movers can offer some of the shorter payback windows among automation technologies, though actual results depend heavily on facility-specific utilization and labor baselines. Collaborative AMR picking systems show payback under 24 months in documented deployments, fast, because the hardware is flexible enough to get redeployed as needs shift. AGVs carry a longer payback window that reflects their higher infrastructure requirements and more fixed installation profile, making facility-specific utilization and integration costs especially important inputs for that technology class.
None of these numbers mean much sitting on their own. They mean something once weighed against a specific facility's utilization reality, its labor baseline, and its integration cost, the three inputs vendor models get wrong in the same direction, nearly every time.